Provides an effortless web interface that connects you with your data
Each site has its own dashboard, with a clear overview of the visitor counts per day. The data from each unit can be easily viewed for easy analysis and comparisons
View historic visitor counts and detailed sensor information, such as solar, temperature, mobile signal strength and many more, for the life of the sensor
Export to Excel options are provided as standard to make it easy for future reporting and offline analysis
Custom alerts, integrations and monitoring are also available.
Please contact us for more information
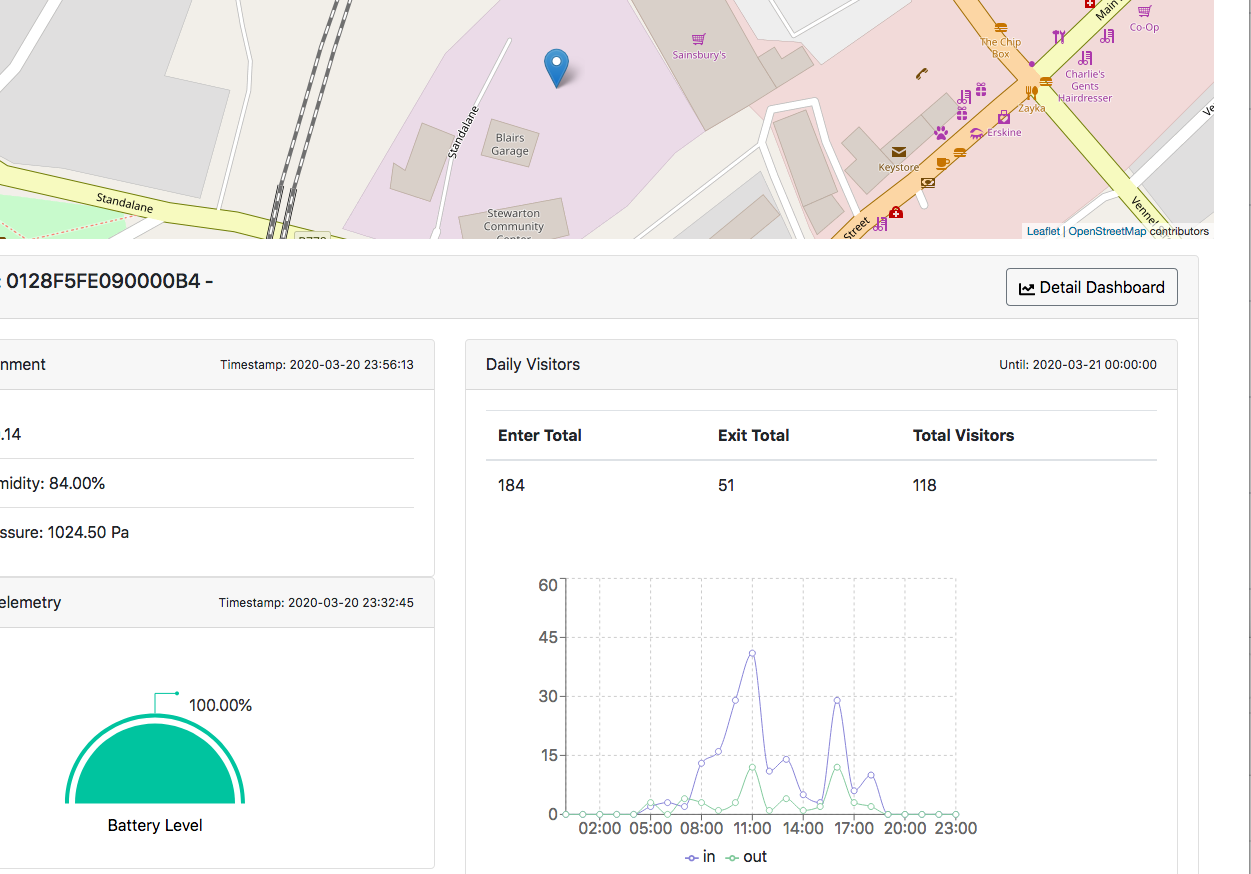
Access the real time sensor information from the Sensor Dashboard. This provides an easy accessible overview of what is happening in real time at the location, with relevant environmental and unit telemetry information.
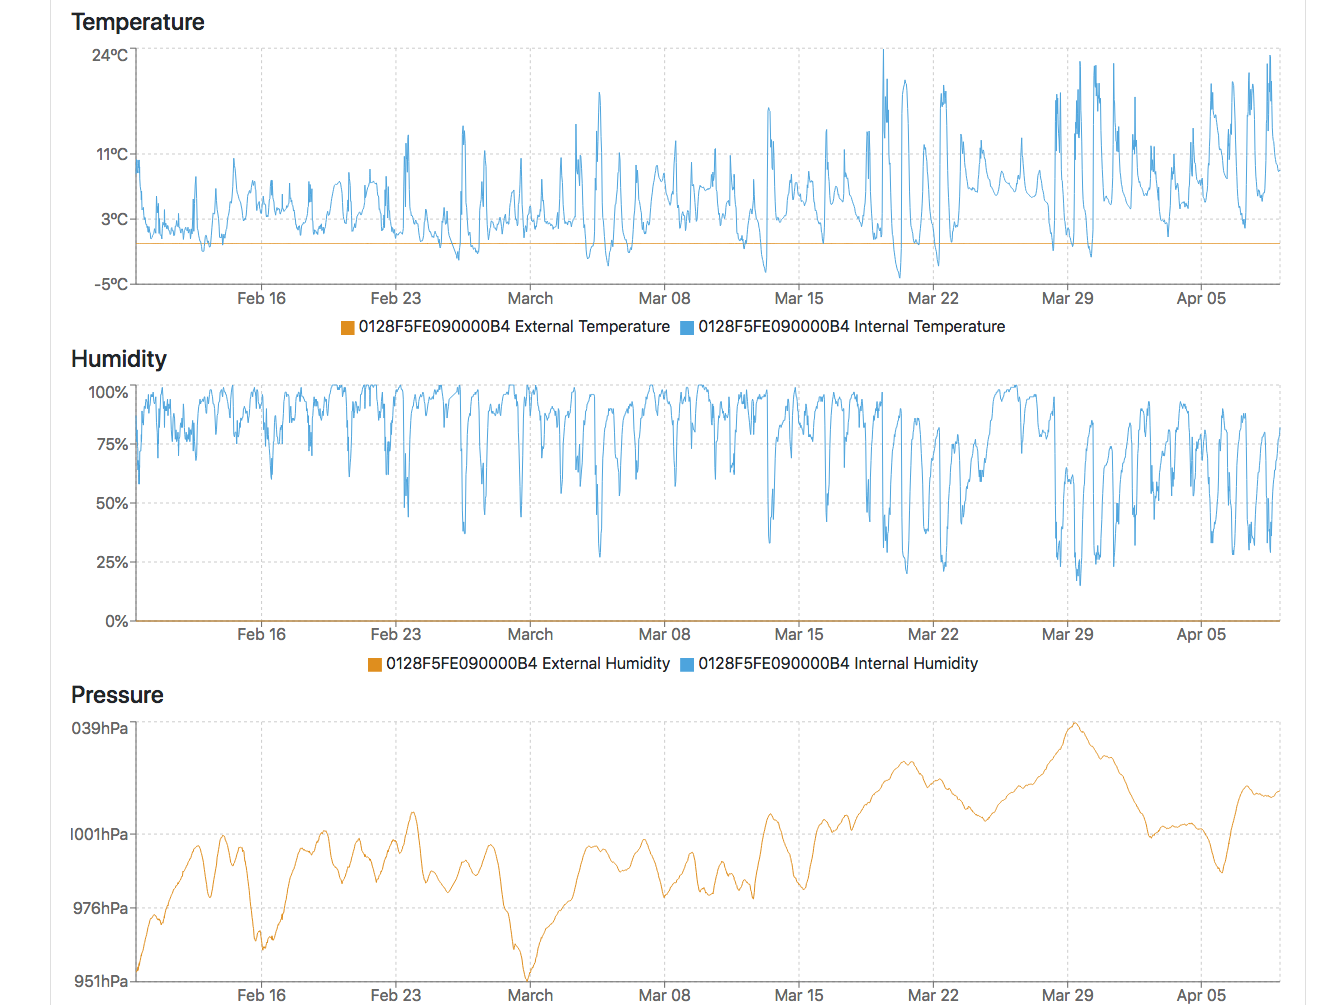
Drill down further into the individual sensor data or review different time periods with the click of a button.
Export the data that you need in an Excel compatible file.
Review Detailed Sensor information. Each sensor unit has its own dashboard showing the primary data (i.e. visitor counts) and associated environmental data (i.e. temperature, humidity, any tampering alerts, connectivity, etc).
The dashboard makes it easy to see patterns in the data and review different historical time periods. The data is also easily exported in an Excel compatible file.
Set up a web page with Mobirise